mtr (short for My Traceroute) is a powerful network diagnostic tool that combines the functionality of ping and traceroute. It provides real-time information about the route packets take from your system to a specified destination and measures latency and packet loss at each hop along the route.
Key Features of mtr
- Combines the functionalities of
pingandtraceroute. - Provides a continuous, real-time view of network performance.
- Displays metrics such as latency, packet loss, and jitter.
- Useful for diagnosing network issues like high latency, routing loops, or packet loss.
Installing mtr
On Linux
- Ubuntu/Debian:
sudo apt update sudo apt install mtr - CentOS/RHEL:
sudo yum install mtr - Fedora:
sudo dnf install mtr
On macOS
Install mtr using Homebrew:
brew install mtrOn Windows
mtr is not natively available for Windows, but you can use it through WSL (Windows Subsystem for Linux) or tools like WinMTR.
Basic Usage of mtr
1. Running a Basic mtr Test
To start an mtr diagnostic:
mtr destinationReplace destination with the hostname or IP address of the target (e.g., google.com or 8.8.8.8).
2. Running mtr as Root
Certain features, such as ICMP requests, require root privileges. Use sudo to run mtr:
sudo mtr destination3. Specifying the Number of Packets
To limit the number of packets sent (e.g., 10 packets):
mtr -c 10 destination4. Running mtr in Report Mode
Generate a report without the live, interactive display:
mtr -r destination5. Save Report to a File
Save the output to a text file for further analysis:
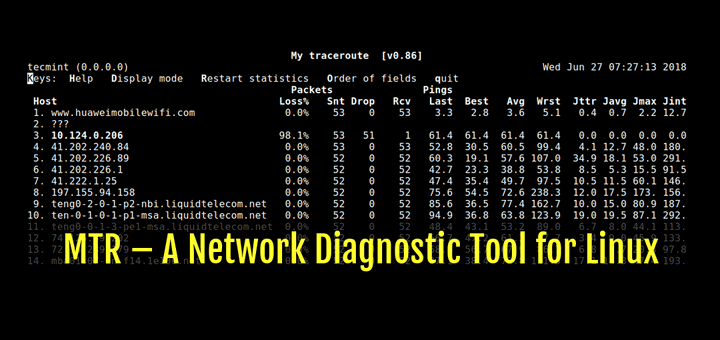
mtr -r destination > report.txtUnderstanding the mtr Output
The mtr output consists of columns that display network performance metrics for each hop along the route:
| Column | Description |
|---|---|
| Host | The hostname or IP address of the hop. |
| Loss% | Percentage of packets lost at this hop. |
| Snt | Number of packets sent. |
| Last | Round-trip time (RTT) of the last packet (in milliseconds). |
| Avg | Average RTT for all packets. |
| Best | Lowest RTT observed. |
| Wrst | Highest RTT observed. |
| StDev | Standard deviation of RTT, indicating jitter. |
Advanced mtr Options
1. Specify Packet Size
To set the size of packets sent by mtr (in bytes):
mtr -s 64 destination2. Use TCP Instead of ICMP
By default, mtr uses ICMP packets. To use TCP packets instead:
sudo mtr --tcp destination3. Specify the Port
To specify a port when using TCP or UDP:
sudo mtr --port 80 --tcp destination4. Set Maximum Hop Count
Limit the number of hops in the trace:
mtr --max-ttl 15 destination5. Resolve Hostnames
By default, mtr resolves hostnames. To disable this for faster results:
mtr -n destination6. Display Both IP and Hostnames
To display both IP addresses and hostnames:
mtr -b destination7. Change the Interval Between Packets
To set the interval (in seconds) between packets:
mtr -i 0.5 destinationExamples of Practical Use Cases
1. Diagnosing Network Latency
Run mtr to a problematic server to identify high latency or slow hops:
mtr google.comLook for hops with high latency in the Avg or Wrst columns.
2. Identifying Packet Loss
If a website or service is unreliable, use mtr to find hops with significant packet loss:
mtr -c 20 example.com3. Monitoring Network Jitter
For real-time applications (e.g., VoIP), monitor jitter by checking the StDev column:
mtr -i 0.5 -c 100 destination4. Saving a Report for Analysis
Run mtr in report mode and save the output for sharing or analysis:
mtr -r google.com > mtr_report.txtConclusion
The mtr command is an essential tool for diagnosing network performance issues. Its real-time and detailed output makes it superior to standalone tools like ping or traceroute. By mastering the features and options outlined in this guide, you can efficiently identify and troubleshoot network problems in a variety of scenarios.