How to Install and Use RStudio for Data Analysis: A Comprehensive Guide

RStudio is a powerful IDE for R programming language, offering various features that simplify data analysis. It combines the core R console with added functionality such as a script editor, data viewer, package management, and integrated plotting tools. RStudio allows users to write and execute R code, create reports, build statistical models, and produce graphs or visualizations in a single, streamlined environment.
Why Use RStudio for Data Analysis?
RStudio’s popularity stems from the following advantages:
- User-Friendly Interface: RStudio offers a well-organized workspace where code, data, plots, and outputs can be viewed simultaneously.
- Integrated Environment: It integrates R with tools for data visualization (ggplot2), statistical computing, and report generation (RMarkdown).
- Cross-Platform Compatibility: RStudio is available on Windows, macOS, and Linux, allowing users from different platforms to work seamlessly.
- Package Support: RStudio makes it easy to install and manage R packages, giving access to thousands of libraries for data manipulation and analysis.
Now, let’s dive into how to install RStudio and use it for data analysis.
Step 1: Installing R and RStudio
Install R
Before installing RStudio, you need to have R installed on your machine. R is the programming language that RStudio runs, so it’s the backbone of the entire process. The installation steps vary depending on your operating system:
For Windows:
- Go to the CRAN website.
- Click on Download R for Windows.
- Select base, then click on the Download R 4.x.x for Windows link.
- Run the downloaded executable file and follow the installation instructions.
For macOS:
- Go to the CRAN website.
- Click on Download R for macOS.
- Choose the appropriate package based on your macOS version and download the installer.
- Open the
.pkgfile and follow the prompts to install R.
For Linux (Ubuntu/Debian):
- Open the terminal and run the following commands to add the CRAN repository:
sudo apt update
sudo apt install r-base
- This will install the latest version of R.
After installing R, you can now proceed to install RStudio.
Install RStudio
- Visit the RStudio website.
- Go to the Products tab and click on RStudio.
- Scroll down to the RStudio Desktop section and click on Download RStudio.
- Download the installer for your operating system (Windows, macOS, or Linux).
- Follow the installation instructions for your platform:
- For Windows: Run the
.exefile and follow the setup instructions. - For macOS: Open the
.dmgfile and drag RStudio into your Applications folder. - For Linux: Open the terminal and use the appropriate commands to install the downloaded package:
- For Windows: Run the
sudo apt install ./rstudio-x.x.x-amd64.deb
Once RStudio is installed, you can open it by searching for “RStudio” in your application launcher or terminal.
Step 2: Getting Started with RStudio
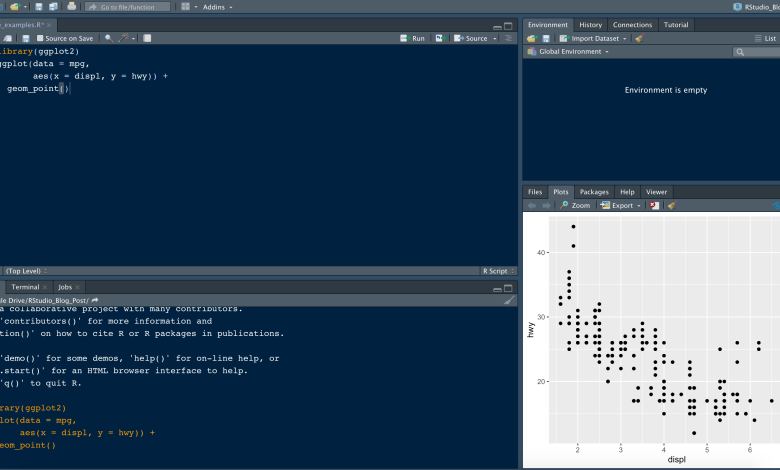
After opening RStudio, you’ll see a user-friendly interface with the following key panes:
- Console: This is where you can enter and execute R commands.
- Script Editor: A space to write and save R scripts for running multiple lines of code at once.
- Environment/History Pane: Displays variables, data frames, and keeps track of the commands you’ve run.
- Files/Plots/Packages/Help Viewer: A multipurpose pane that displays plots, manages R packages, and provides access to the R help system.
The Script Editor and Console
RStudio’s script editor allows you to write, edit, and save scripts that contain multiple lines of code. You can run code line by line or run the entire script at once. This is a useful feature when you’re working with large datasets or building complex models.
The Console allows you to run individual commands immediately and see the results. For example, if you want to calculate the sum of two numbers, you would type:
> 2 + 3
Once you press Enter, RStudio will return the result in the console.
The Environment Tab
The Environment tab in the top-right pane displays all active variables and data objects in your R session. If you load a dataset, create variables, or generate plots, you will see them listed here. You can also view and manage data frames, allowing you to inspect your datasets before analysis.
Step 3: Installing and Using R Packages
R packages are collections of functions and datasets that enhance R’s functionality. RStudio makes it easy to install and load packages.
Installing Packages
To install a package, use the install.packages() function in the console. For example, to install the ggplot2 package for data visualization:
install.packages(“ggplot2”)
After installation, you need to load the package using the library() function:


