Wireshark is one of the most popular tools for network protocol analysis. It provides a graphical interface to capture and inspect network packets in real time, making it invaluable for troubleshooting, performance analysis, and security auditing. This guide explains how to install and use Wireshark for effective network analysis.
1. What is Wireshark?
Wireshark is an open-source network protocol analyzer. It captures network traffic and allows users to examine it in detail. Key features include:
- Support for numerous protocols.
- Real-time packet capturing and offline analysis.
- Powerful filtering and search capabilities.
- User-friendly graphical interface.
2. Installing Wireshark
2.1 Installation on Windows
- Download Wireshark:
- Visit the official website: https://www.wireshark.org.
- Download the appropriate installer for your system (32-bit or 64-bit).
- Run the Installer:
- Follow the installation wizard.
- Select the optional components you need, such as USBPcap for USB traffic analysis.
- Grant Permissions:
- Wireshark requires administrative privileges for packet capture. Allow it when prompted.
2.2 Installation on macOS
- Download Wireshark:
- Use the macOS installer available on the Wireshark website.
- Install via Homebrew (Alternative):
brew install --cask wireshark - Grant Permissions:
- macOS may require additional configuration for packet capture. Follow the prompts to grant permissions.
2.3 Installation on Linux
Wireshark can be installed using your distribution’s package manager.
Ubuntu/Debian:
sudo apt update
sudo apt install wireshark
Fedora:
sudo dnf install wiresharkArch Linux:
sudo pacman -S wireshark-qtPost-Installation Configuration
- Add your user to the Wireshark group to capture packets without root privileges:
sudo usermod -aG wireshark $USER - Log out and log back in for the changes to take effect.
3. Capturing Packets with Wireshark
3.1 Starting Wireshark
- Open Wireshark from your application menu or terminal.
- Select the network interface you want to monitor. Common interfaces include
eth0,wlan0, oren0.
3.2 Capturing Traffic
- Click on the desired interface.
- Click the green Start Capturing Packets button.
- Wireshark will begin capturing all traffic on the selected interface.
3.3 Stopping the Capture
- Click the red Stop Capturing Packets button to stop the capture.
4. Using Filters
Wireshark captures all packets by default, which can be overwhelming. Filters help narrow down the traffic to what you need.
4.1 Display Filters
- Apply filters to analyze specific traffic.
- Examples:
- Show only HTTP traffic:
http - Display packets from a specific IP:
ip.addr == 192.168.1.1 - Show packets to or from a port:
tcp.port == 80
- Show only HTTP traffic:
4.2 Capture Filters
- Set filters before starting a capture to limit data collection.
- Examples:
- Capture traffic from a specific IP:
host 192.168.1.1 - Capture only TCP traffic:
tcp
- Capture traffic from a specific IP:
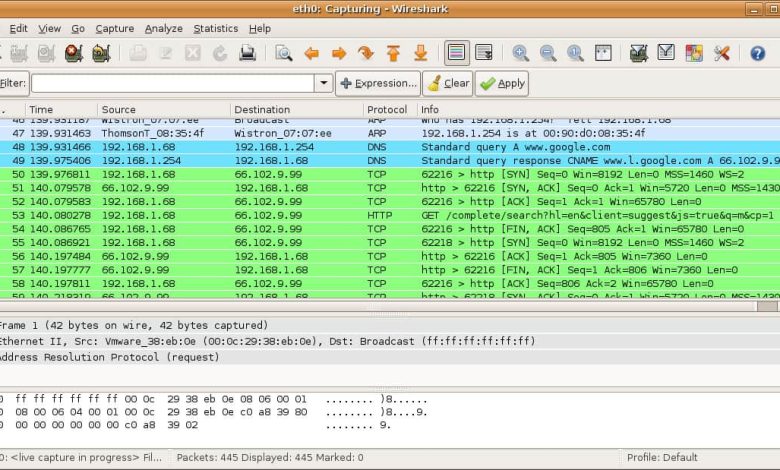
5. Analyzing Packets
5.1 Understanding Packet Details
- Packet List Pane: Displays all captured packets.
- Packet Details Pane: Shows detailed information about the selected packet.
- Packet Bytes Pane: Displays raw packet data in hexadecimal and ASCII formats.
5.2 Follow a Stream
- To view a complete communication stream:
- Right-click a packet.
- Select Follow > TCP Stream (or similar for UDP/HTTP).
5.3 Exporting Captured Data
- Save captured packets for future analysis:
- File > Save As > Choose a
.pcapor.pcapngformat.
- File > Save As > Choose a
6. Advanced Features
6.1 Protocol Decoding
- Wireshark decodes many protocols automatically.
- You can manually decode traffic:
- Right-click a packet > Decode As > Select the desired protocol.
6.2 Customizing Wireshark
- Color Rules: Highlight specific types of traffic for easier analysis.
- Edit > Preferences > Appearance > Colors.
- Custom Profiles: Create profiles for different analysis tasks.
6.3 Using Command-Line Tools
- Wireshark includes
tshark, a command-line packet analysis tool:tshark -i eth0 -f "tcp port 80" -w output.pcap
7. Best Practices
- Use Filters Effectively: Limit the scope of captures and analysis to avoid overwhelming data.
- Capture in a Controlled Environment: Isolate the network when possible to reduce noise.
- Understand Legal and Ethical Boundaries: Ensure you have permission before capturing traffic.
- Keep Wireshark Updated: Regular updates add support for new protocols and security fixes.
8. Conclusion
Wireshark is a versatile tool for network analysis, suitable for beginners and experts alike. With its ability to capture, filter, and analyze packets in real time, it’s an indispensable tool for diagnosing network issues, improving performance, and ensuring security. By following this guide, you can set up and use Wireshark effectively for your network analysis tasks.